Welcome to China Oncology,
Fig/Tab
Adv Search
Home
Journal Information
About China Oncology
Open Access Statement
Index
Awards
Advertising Policy
Contact Us
Subscriptions
Editorial Board
Editorial Board Members
Youth Editorial Board Members
For Authors
Guide for Authors
Paper Template
Copyright
Others
For Reviewers
Guidelines for Reviewers
China Oncology Peer Review Policies
Archive
Just Accepted
Archive
Most Read
Most Download
Ethics and Policies
Article Screening for Plagiarism Policy
Statement on the Publishing Ethics and Publication Malpractice
China Oncology Editorial Policies
Process for Handling Cases Requiring Corrections, Retractions, and Editorial Expressions of Concern
Research Ethics policy
Statement on Fund Review
Email Alert
Online Lecture
中文
Image/Table Caption
Journals
Article DOI
ALL
China Oncology
Publication Year From
Publication Year To
FromYear
2013
2014
2015
2016
2017
2018
2019
2020
2021
2022
2023
2024
2025
ToYear
2025
2024
2023
2022
2021
2020
2019
2018
2017
2016
2015
2014
2013
Volume
Issue
Author
Institution
Journals
Publication Years
Information about the GEO data and series
Databases related to bioinformatics analysis
GSE62153 GO function analysis
GSE58399 GO function and KEGG signal pathway enrichment analysis
Enrichment of KEGG signaling pathway in GSE62153 dataset
PPI network
Bioinformatics screening of Hub gene
Venn diagram of DEG and Hub gene
Survival analysis of TCGA and CGGA database
The higher expression groups were favorable than those of patients with lower expression. A: Analysis of ERMN expression in TCGA database; B: Analysis of MOG expression in TCGA database; C: Analysis of MOBP expression in TCGA database; D: Analysis of ERMN expression in CGGA database; E: Analysis of MOG Expression in CGGA database; F: Analysis of MOBP expression in CGGA database.
mRNA expression of
ERMN
,
MOG
and
MOBP
genes in control tissues and glioma tissues
N: Control tissues; T: Glioma tissues. A: mRNA expression of
ERMN
gene in control tissues and glioma tissues; B: mRNA expression of
MOG
gene in control tissues and glioma tissues; C: mRNA expression of
MOBP
gene in control tissues and glioma tissues; D: mRNA expression of
ERMN
gene in different WHO grades of glioma; E: mRNA expression of
MOG
gene in different WHO grades of glioma; F: mRNA expression of
MOBP
gene in different WHO grades of glioma. *:
P
<0.05, compared with control tissues.
Association between
ERMN
,
MOG
and
MOBP
genes expressions and the patient's clinicopathological characteristics in patients with glioma (
n
)
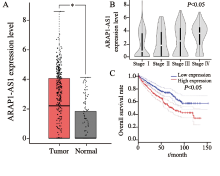
Expression of ARAP1-AS1 in ccRCC in the GEPIA database and its relation to survival rate and tumor stage of the patients
A: Expression level of ARAP1-AS1 in ccRCC tissues; B: Relationship between ARAP1-AS1 expression level and tumor stage; C: Relationship between the expression levels of ARAP1-AS1 and the overall survival rate;
*
:
P
<0.05, compared with tumor.
ARAP1-AS1 expression in ccRCC tissues and cell lines and survival analysis of the patients
A: ccRCC tissues; B: ccRCC cell lines; C: Survival analysis;
*
: P<0.05, compared with para-cancerous tissues; #: P<0.05, compared with HK2.
Relationship between expression of ARAP1-AS1 and clinicopathological features in patients with ccRCC
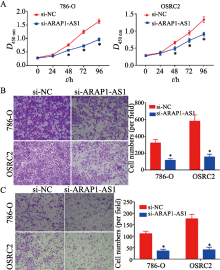
Effect of ARAP1-AS1 on the proliferation, migration, and invasion capacity of ccRCC cells
A: Cell proliferation; B: Cell migration; C: Cell invasion;
*
: P<0.05, compared with si-NC.
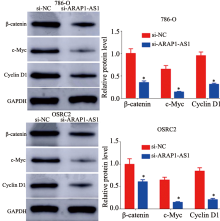
Effect of silencing of ARAP1-AS1 on the Wnt/β-catenin signaling pathway
*
: P<0.05, compared with si-NC.
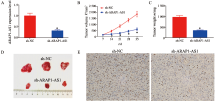
Effect of ARAP1-AS1 on the proliferation, migration, and invasion capacity of ccRCC cells
A: Silencing efficiency of sh-ARAP1-AS1; B: Growth curves of the xenograft tumors; C: Tumor weights; D: Xenograft tumors; E: Immunohistochemistry;
*
: P<0.05, compared with si-NC.
The results of GIST indicators between the different risk groups
The comparison of indicators in different risk groups
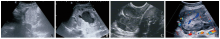
The ultrasonic findings of GIST with different locations and risk grades
A: Low-risk gastric stromal tumor; B: High-risk gastric stromal tumor; C: High-risk rectal stromal tumor; D: High-risk mesostenium stromal tumor.
page
Page 1 of 98
Total 1958 records
First page
Prev page
Next page
Last page