Welcome to China Oncology,
China Oncology ›› 2025, Vol. 35 ›› Issue (6): 543-554.doi: 10.19401/j.cnki.1007-3639.2025.06.003
• Article • Previous Articles Next Articles
DU Kewei1( ), ZHANG Shangdi1, HU Wenfei1, GAO Shan1, GAN Jianxin2, YOU Chongge1()
Received:2025-03-03
Revised:2025-05-30
Online:2025-06-30
Published:2025-07-14
Contact:
YOU Chongge
Share article
CLC Number:
DU Kewei, ZHANG Shangdi, HU Wenfei, GAO Shan, GAN Jianxin, YOU Chongge. Discovery and preliminary validation of five early gastric cancer biomarkers, including TAGLN2 and CTSD, based on serum proteomics[J]. China Oncology, 2025, 35(6): 543-554.
Tab. 1
Primers used in qRT-PCR"
| Genes | Sequence |
|---|---|
| B2M(human) | Forward: 5’-TGTCTCGCTCCGTGGCCTTAG-3’ |
| Reverse: 5’-CTCTGCTGGATGACGTGAGTAAACC-3’ | |
| TAGLN2(human) | Forward: 5’-ATGGCACGGTGCTATGTGAG-3’ |
| Reverse: 5’-CCCACCCAGATTCATCAGCG-3’ | |
| CTSD(human) | Forward: 5’-ACGGGCTCCTCCAACCTGTG-3’ |
| Reverse: 5’-TGGACTTGTCGCTGTTGTACTTGTG-3’ | |
| HSP90AB1(human) | Forward: 5’-GAAACCGCCCTGCTATCTTCTGG-3’ |
| Reverse: 5’-CCTCTGCTGCCACTTCATCTTCATC-3’ | |
| SH3BGRL3(human) | Forward: 5’-CTCCCGCGAAATCAAGTCCC-3’ |
| Reverse: 5’-CCCGTTGACAATCTGGGGTG-3’ | |
| CFL1(human) | Forward: 5’-TACGCCACCTTTGTCAAGATG-3’ |
| Reverse: 5’-CCTTGGAGCTGGCATAAATCAT-3’ |
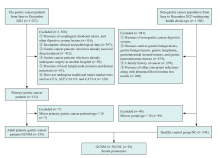
Fig. 1
Flow diagram of participants’ selection GCNM: Gastric cancer, non-metastatic; NC: Healthy normal control."
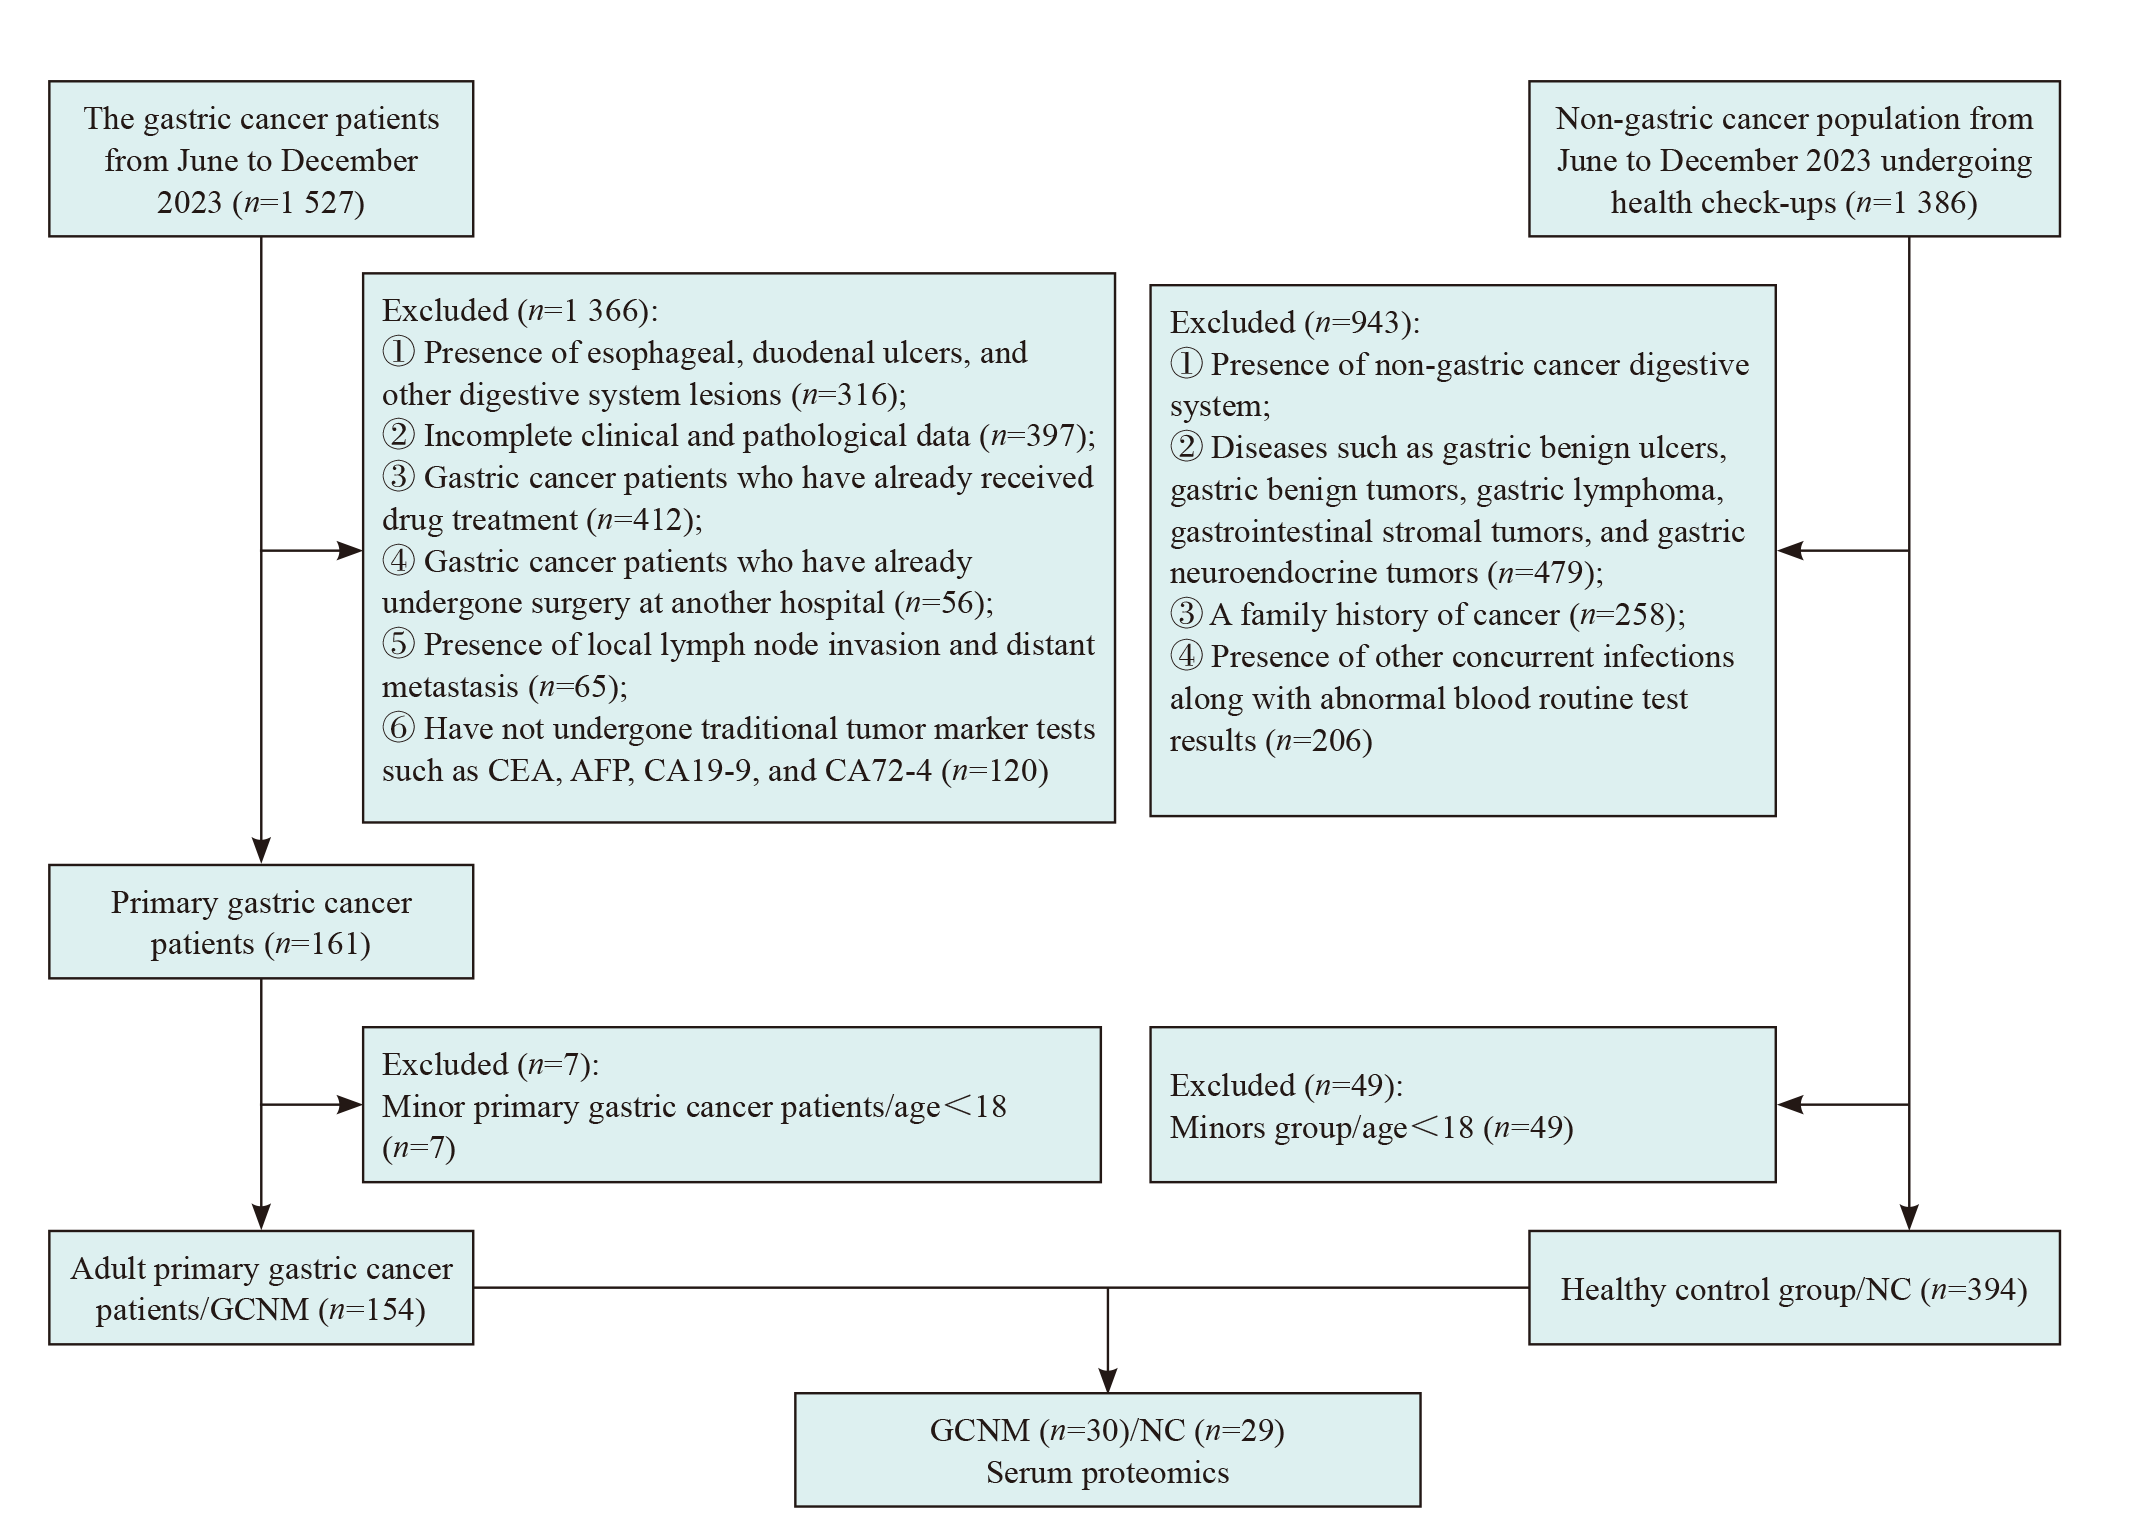
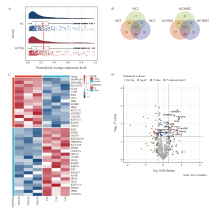
Fig. 2
Proteomic analysis of serum samples from patients with non-metastatic gastric cancer (GCNM) and healthy normal control (NC) groups A: Raincloud plot illustrating the normalized relative abundance of serum proteins, summarizing the median, mean, and confidence interval. The X-axis represents the log-transformed normalized relative abundance of each protein. B: Overlap analysis of identified proteins in the GCNM and NC groups. A total of 717 proteins were detected in the NC group, with 573 overlapping proteins (79.92%). In the GCNM group, 750 proteins were identified, including 597 overlapping proteins (79.60%). C: Heatmap comparing the expression of all differentially expressed proteins across different groups, where red indicated high expression and blue indicated low expression. D: Volcano plot illustrating gene expression differences between the GCNM and NC groups. Each dot representd an individual protein. FC denotes the fold change in protein abundance. The vertical dashed lines indicated log2(FC) thresholds, corresponding to |FC|≥1.5, respectively. The horizontal dashed line represented the P value threshold (P<0.05). Proteins with FC≥1.5 and P<0.05 were considered significantly upregulated in the GCNM group."

Tab. 2
Differentially expressed genes between the GCNM and NC groups"
| Genes | Protein IDs | GCNM average | NC average | P value* | GCNM-vs-NC Regulation |
|---|---|---|---|---|---|
| HSP90AB1 | P08238 | 0.232 | 0.080 | 0.002 | Up |
| SH3BGRL3 | Q9H299 | 0.105 | 0.044 | 0.004 | Up |
| KIAA1958 | Q8N8K9 | 0.814 | 0.244 | 0.005 | Up |
| FLNA | P21333 | 0.153 | 0.048 | 0.006 | Up |
| CTSD | P07339 | 0.125 | 0.081 | 0.011 | Up |
| B2M | P61769 | 0.682 | 0.355 | 0.013 | Up |
| CFL1 | P23528 | 0.354 | 0.186 | 0.015 | Up |
| MPO | P05164 | 0.133 | 0.079 | 0.017 | Up |
| IGFBP2 | P18065 | 0.162 | 0.091 | 0.018 | Up |
| HPSE | Q9Y251 | 0.058 | 0.019 | 0.020 | Up |
| IGLV1-51 | P01701 | 15.209 | 6.972 | 0.021 | Up |
| ANTXR1 | Q9H6X2 | 0.060 | 0.021 | 0.023 | Up |
| TAGLN2 | P37802 | 0.324 | 0.116 | 0.024 | Up |
| IGHV3-21 | A0A0B4J1V1 | 0.092 | 0.052 | 0.025 | Up |
| RAP1B | P61224 | 0.141 | 0.049 | 0.032 | Up |
| GSTO1 | P78417 | 0.117 | 0.055 | 0.040 | Up |
| IGKC | P01834 | 46.167 | 83.347 | 0.001 | Down |
| PTPRJ | Q12913 | 0.101 | 0.183 | 0.003 | Down |
| CHST9 | Q7L1S5 | 0.317 | 1.457 | 0.004 | Down |
| IGKV2D-30 | A0A075B6S6 | 0.082 | 0.264 | 0.005 | Down |
| HNRNPA1 | P09651 | 0.105 | 0.185 | 0.006 | Down |
| IGLV4-69 | A0A075B6H9 | 0.300 | 3.710 | 0.012 | Down |
| MDH2 | P40926 | 0.044 | 0.101 | 0.014 | Down |
| CORO1A | P31146 | 0.053 | 0.198 | 0.014 | Down |
| ABCC5 | O15440 | 0.836 | 2.019 | 0.019 | Down |
| CENPU | Q71F23 | 0.071 | 0.129 | 0.020 | Down |
| NME2 | P22392 | 0.059 | 0.095 | 0.022 | Down |
| RBBP9 | O75884 | 0.227 | 0.472 | 0.027 | Down |
| PARVG | Q9HBI0 | 0.192 | 0.381 | 0.028 | Down |
| PZP | P20742 | 0.844 | 1.740 | 0.028 | Down |
| B4GAT1 | O43505 | 0.011 | 0.029 | 0.035 | Down |
| AFDN | P55196 | 0.062 | 0.098 | 0.035 | Down |
| HBA2 | P69905 | 26.864 | 45.432 | 0.036 | Down |
| GOT1 | P17174 | 0.028 | 0.053 | 0.038 | Down |
| IGHV1-45 | A0A0A0MS14 | 0.466 | 0.713 | 0.038 | Down |
| PRDX2 | P32119 | 0.122 | 0.196 | 0.042 | Down |
| UBR4 | Q5T4S7 | 0.055 | 0.091 | 0.045 | Down |
| TUBA4A | P68366 | 0.015 | 0.038 | 0.046 | Down |

Fig. 3
Protein-protein interactions and GO and KEGG analysis of upregulated proteins A: Protein-protein interaction (PPI) network of differentially expressed proteins obtained through STRING analysis. B: KEGG pathway analysis of the top 10 interacting proteins. The dot size represented the number of genes associated with each enriched pathway. C: GO analysis of the top 10 interacting proteins. The dot size represented the number of genes associated with each enriched term. P<0.05 is considered statistically significant."
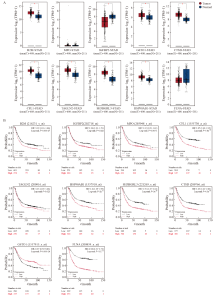
Fig. 4
Expression differences of interacting protein genes in gastric cancer tissues and their association with poor patient prognosis A: Differential expression analysis of genes corresponding to interacting proteins between the gastric cancer group and the healthy group, based on TCGA and GTEx datasets using GEPIA 2. B: Correlation curves between interacting protein gene expression and overall survival in gastric cancer patients. HR>1 indicated a positive correlation, while HR<1 indicated a negative correlation. *: P<0.05, compared with each other."
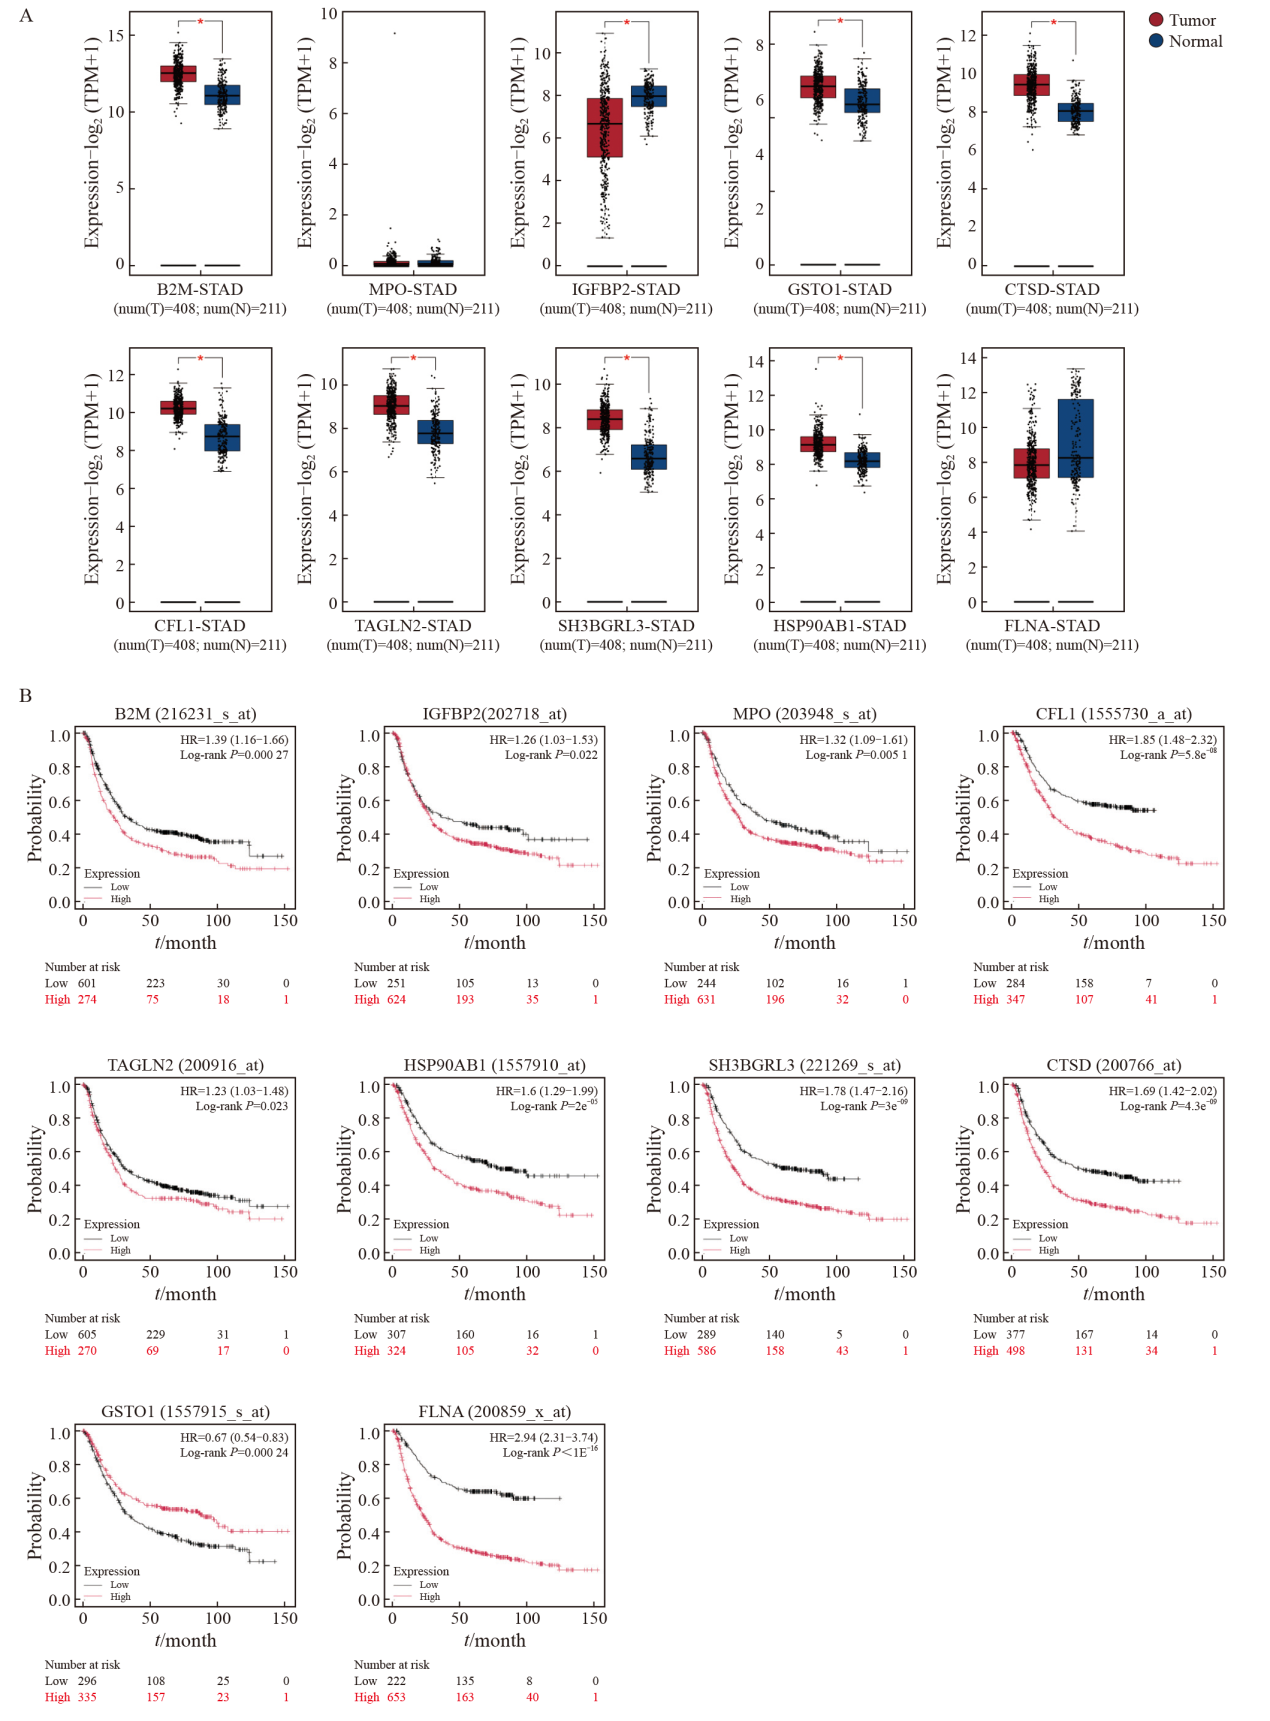
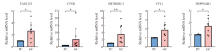
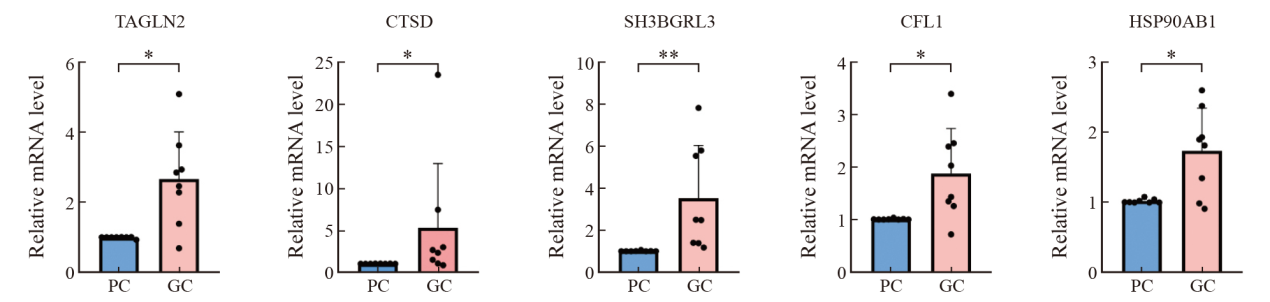
Fig. 5
qRT-PCR analysis of core genes between the para-cancerous tissues and gastric tissues PC: Para-cancerous tissues; GC: Gastric tissues. *: P<0.05, compared with each other; **: P<0.01, compared with each other."
| [1] |
THRIFT A P, WENKER T N, EL-SERAG H B. Global burden of gastric cancer: epidemiological trends, risk factors, screening and prevention[J]. Nat Rev Clin Oncol, 2023, 20(5): 338-349.
doi: 10.1038/s41571-023-00747-0 pmid: 36959359 |
| [2] | WONG M C S, HUANG J J, CHAN P S F, et al. Global incidence and mortality of gastric cancer, 1980-2018[J]. JAMA Netw Open, 2021, 4(7): e2118457. |
| [3] | JELSKI W, MROCZKO B. Molecular and circulating biomarkers of gastric cancer[J]. Int J Mol Sci, 2022, 23(14): 7588. |
| [4] | SHEN N, ZHU S S, ZHANG Z Y, et al. High expression of COL10A1 is an independent predictive poor prognostic biomarker and associated with immune infiltration in advanced gastric cancer microenvironment[J]. J Oncol, 2022, 2022: 1463316. |
| [5] | FENG L R, LI G X, LI D B, et al. Cuproptosis-related gene SERPINE1 is a prognostic biomarker and correlated with immune infiltrates in gastric cancer[J]. J Cancer Res Clin Oncol, 2023, 149(12): 10851-10865. |
| [6] | 中华人民共和国国家卫生健康委员会医政医管局, 季加孚. 胃癌诊疗指南(2022年版)[J]. 中华消化外科杂志, 2022, 21(9): 1137-1164. |
| Medical Administration Bureau of the National Health Commission of the People's Republic of China, JI J F. Standardization for diagnosis and treatment of gastric cancer(2022 edition)[J]. Chin J Dig Surg, 2022, 21(9): 1137-1164. | |
| [7] | CHEN T, MA J, LIU Y, et al. iProX in 2021: connecting proteomics data sharing with big data[J]. Nucleic Acids Res, 2022, 50(D1): D1522-D1527. |
| [8] | SZKLARCZYK D, KIRSCH R, KOUTROULI M, et al. The STRING database in 2023: protein-protein association networks and functional enrichment analyses for any sequenced genome of interest[J]. Nucleic Acids Res, 2023, 51(D1): D638-D646. |
| [9] | GYŐRFFY B. Integrated analysis of public datasets for the discovery and validation of survival-associated genes in solid tumors[J]. Innovation (Camb), 2024, 5(3): 100625. |
| [10] | TANG D D, CHEN M J, HUANG X H, et al. SRplot: a free online platform for data visualization and graphing[J]. PLoS One, 2023, 18(11): e0294236. |
| [11] | FENG T, JIE M W, DENG K, et al. Targeted plasma proteomic analysis uncovers a high-performance biomarker panel for early diagnosis of gastric cancer[J]. Clin Chim Acta, 2024, 558: 119675. |
| [12] | MORGOS D T, STEFANI C, MIRICESCU D, et al. Targeting PI3K/AKT/mTOR and MAPK signaling pathways in gastric cancer[J]. Int J Mol Sci, 2024, 25(3): 1848. |
| [13] |
WANG Y L, TU Z Y, ZHAO W, et al. PLCB1 enhances cell migration and invasion in gastric cancer via regulating actin cytoskeletal remodeling and epithelial-mesenchymal transition[J]. Biochem Genet, 2023, 61(6): 2618-2632.
doi: 10.1007/s10528-023-10396-8 pmid: 37208557 |
| [14] | NAJAR M A, ARAVIND A, DAGAMAJALU S, et al. Hyperactivation of MEK/ERK pathway by Ca2+/calmodulin-dependent protein kinase kinase 2 promotes cellular proliferation by activating cyclin-dependent kinases and minichromosome maintenance protein in gastric cancer cells[J]. Mol Carcinog, 2021, 60(11): 769-783. |
| [15] |
WANG Q, XU C, FAN Q, et al. Positive feedback between ROS and cis-axis of PIASxα/p38α-SUMOylation/MK2 facilitates gastric cancer metastasis[J]. Cell Death Dis, 2021, 12(11): 986.
doi: 10.1038/s41419-021-04302-6 pmid: 34686655 |
| [16] |
WANG Y W, QI H, LIU Y, et al. The double-edged roles of ROS in cancer prevention and therapy[J]. Theranostics, 2021, 11(10): 4839-4857.
doi: 10.7150/thno.56747 pmid: 33754031 |
| [17] |
LI D Q, ZHANG Q, LI L, et al. β2-microglobulin maintains glioblastoma stem cells and induces M2-like polarization of tumor-associated macrophages[J]. Cancer Res, 2022, 82(18): 3321-3334.
doi: 10.1158/0008-5472.CAN-22-0507 pmid: 35841593 |
| [18] |
LIN Q M, JIANG Z W, MO D, et al. Beta2-microglobulin as predictive biomarkers in the prognosis of hepatocellular carcinoma and development of a new nomogram[J]. J Hepatocell Carcinoma, 2023, 10: 1813-1825.
doi: 10.2147/JHC.S425344 pmid: 37850078 |
| [19] |
WANG H B, LIU B R, WEI J. Beta2-microglobulin(B2M) in cancer immunotherapies: biological function, resistance and remedy[J]. Cancer Lett, 2021, 517: 96-104.
doi: 10.1016/j.canlet.2021.06.008 pmid: 34129878 |
| [20] | REIS B, ATTIG J, DZIADEK S, et al. Tumor beta2-microglobulin and HLA-a expression is increased by immunotherapy and can predict response to CIT in association with other biomarkers[J]. Front Immunol, 2024, 15: 1285049. |
| [21] | YIN L M, ULLOA L, YANG Y Q. Transgelin-2: biochemical and clinical implications in cancer and asthma[J]. Trends Biochem Sci, 2019, 44(10): 885-896. |
| [22] |
JI C B, ZHAO J J, CHEN H, et al. Single-cell RNA sequencing reveals the lineage of malignant epithelial cells and upregulation of TAGLN2 promotes peritoneal metastasis in gastric cancer[J]. Clin Transl Oncol, 2023, 25(12): 3405-3419.
doi: 10.1007/s12094-023-03194-6 pmid: 37247132 |
| [23] |
PAN T, WANG S B, WANG Z Y. An integrated analysis identified TAGLN2 as an oncogene indicator related to prognosis and immunity in pan-cancer[J]. J Cancer, 2023, 14(10): 1809-1836.
doi: 10.7150/jca.84454 pmid: 37476180 |
| [24] | LEE S G, WOO S M, SEO S U, et al. Cathepsin D promotes polarization of tumor-associated macrophages and metastasis through TGFBI-CCL20 signaling[J]. Exp Mol Med, 2024, 56(2): 383-394. |
| [25] | SEO S U, WOO S M, IM S S, et al. Cathepsin D as a potential therapeutic target to enhance anticancer drug-induced apoptosis via RNF183-mediated destabilization of Bcl-xL in cancer cells[J]. Cell Death Dis, 2022, 13(2): 115. |
| [26] | WANG H N, DENG G X, AI M L, et al. Hsp90ab1 stabilizes LRP5 to promote epithelial-mesenchymal transition via activating of AKT and Wnt/β-catenin signaling pathways in gastric cancer progression[J]. Oncogene, 2019, 38(9): 1489-1507. |
| [27] | JIA L Q, GE X L, DU C, et al. EEF1A2 interacts with HSP90AB1 to promote lung adenocarcinoma metastasis via enhancing TGF-β/SMAD signalling[J]. Br J Cancer, 2021, 124(7): 1301-1311. |
| [28] | LIN X, LIU Y H, ZHANG H Q, et al. DSCC1 interacts with HSP90AB1 and promotes the progression of lung adenocarcinoma via regulating ER stress[J]. Cancer Cell Int, 2023, 23(1): 208. |
| [29] | NIE Z, CHENG D T, PAN C L, et al. SH3BGRL3, transcribed by STAT3, facilitates glioblastoma tumorigenesis by activating STAT3 signaling[J]. Biochem Biophys Res Commun, 2021, 556: 114-120. |
| [30] | SOUSA-SQUIAVINATO A C M, MORGADO-DÍAZ J A. A glimpse into cofilin-1 role in cancer therapy: a potential target to improve clinical outcomes?[J]. Biochim Biophys Acta Rev Cancer, 2024, 1879(2): 189087. |
| Viewed | ||||||
|
Full text |
|
|||||
|
Abstract |
|
|||||
沪ICP备12009617
Powered by Beijing Magtech Co. Ltd