基于胸部增强CT影像组学模型用于胸腺瘤分类的研究
Contrast-enhanced computed tomography-based radiomics models for the risk categorization of thymoma
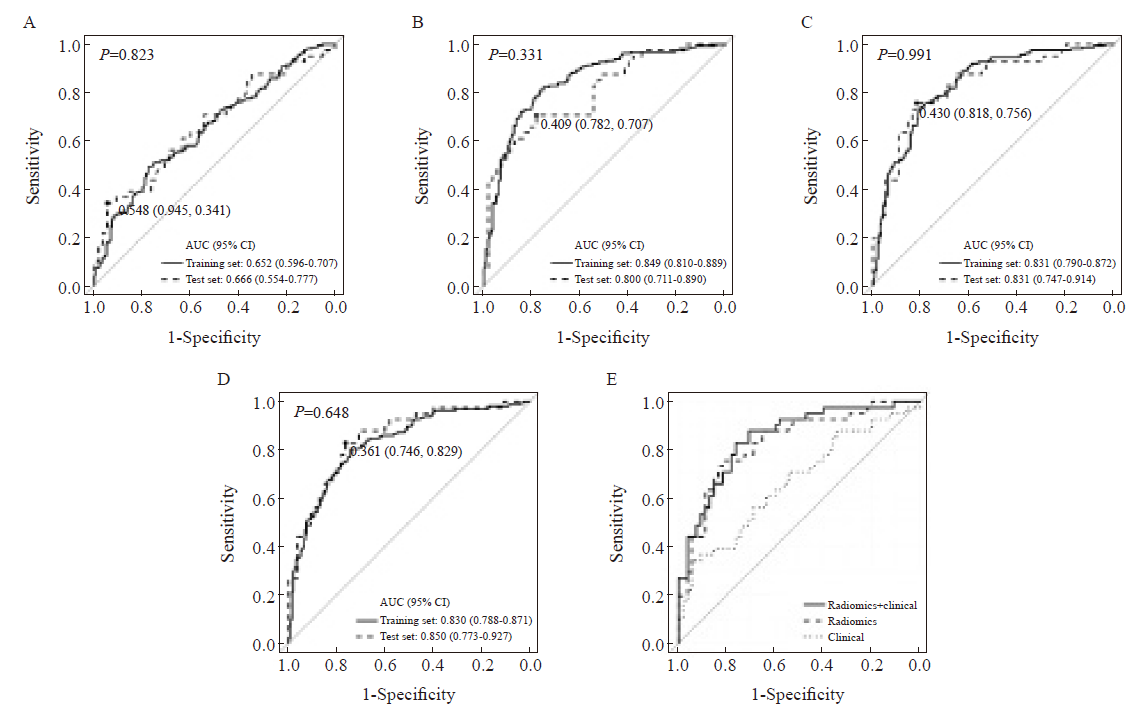
A: ROC curve of the QDA model based on clinical features with an area under the ROC curve (AUC) of 0.652 (95% CI: 0.596-0.707) and 0.666 (95% CI: 0.554-0.777) on the training and test sets. The sensitivity and specificity at the best decision point were 0.341 and 0.945 on the test set. B: LDA model using fourteen radiomics features with an AUC of 0.849 on the training set and 0.800 on the test set. Sensitivity and specificity were 0.707 and 0.782 on the test set. C: QDA model using four radiomics features with an AUC of 0.831 on both the training and test sets. Sensitivity and specificity were 0.756 and 0.818, respectively, on the test set. D: Logistic regression model based on clinical and radiomic features with an AUC of 0.830 (95% CI: 0.788-0.871) and 0.850 (95% CI: 0.773-0.927) on the training and test set, respectively. Sensitivity and specificity were 0.829 and 0.764 on the test set. E: Comparison of the ROC curves of the three models.