Welcome to China Oncology,
China Oncology ›› 2025, Vol. 35 ›› Issue (7): 672-684.doi: 10.19401/j.cnki.1007-3639.2025.07.006
• Specialist's Article • Previous Articles Next Articles
LIU Shuo1( ), LU Yun1, HU Jilin1, YANG Wenchang1, ZHAO Rizhi2, XU Wenda1, YANG Hanyu1, LU Zechen1, MA Zheng1, DU Zhaolin1, GAO Yunzhi1, GAO Yuan1()
Received:2025-05-21
Revised:2025-07-16
Online:2025-07-30
Published:2025-08-13
Contact:
GAO Yuan
Supported by:Share article
CLC Number:
LIU Shuo, LU Yun, HU Jilin, YANG Wenchang, ZHAO Rizhi, XU Wenda, YANG Hanyu, LU Zechen, MA Zheng, DU Zhaolin, GAO Yunzhi, GAO Yuan. The predictive value and model establishment of body composition in the long-term prognosis of patients after rectal cancer surgery[J]. China Oncology, 2025, 35(7): 672-684.
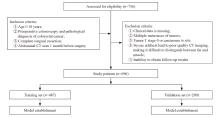
Fig. 1
Patient inclusion and exclusion flow chart"
Tab. 1
Comparison of clinical characteristics and body composition between the training cohort and the validation cohort [n (%)]"
| Variable | Total (N=696) | Training cohort (N=487) | Validation cohort (N=209) | χ2/Z value | P value |
|---|---|---|---|---|---|
| RFS M(Q1,Q3) | 43.0 (38.0, 54.8) | 42.0 (38.0, 50.0) | 42.0 (38.0, 57.0) | -0.615 | 0.539 |
| OS M(Q1,Q3) | 43.0 (38.0, 58.0) | 44.0 (37.0, 57.5) | 45.0 (38.0, 58.0) | -0.550 | 0.582 |
| Gender | 0.889 | 0.346 | |||
| Male | 352 (50.6) | 252 (51.7) | 100 (47.8) | ||
| Female | 344 (49.4) | 235 (48.3) | 109 (52.2) | ||
| Age/year | 0.335 | 0.563 | |||
| <65 | 338 (48.6) | 240 (49.3) | 98 (46.9) | ||
| ≥65 | 358 (51.4) | 247 (50.7) | 111 (53.1) | ||
| BMI/(kg·m-2) | 0.001 | 0.976 | |||
| <22.45 | 166 (23.9) | 116 (23.8) | 50 (23.9) | ||
| ≥22.45 | 530 (76.1) | 371 (76.2) | 159 (76.1) | ||
| CEA/(ng·mL-1) | 0.533 | 0.465 | |||
| <4.26 | 371 (53.3) | 264 (54.2) | 107 (51.2) | ||
| ≥4.26 | 325 (46.7) | 223 (45.8) | 102 (48.8) | ||
| Size/cm | 0.012 | 0.914 | |||
| <5.2 | 445 (63.9) | 312 (64.1) | 133 (63.6) | ||
| ≥5.2 | 251 (36.1) | 175 (35.9) | 76 (36.4) | ||
| T stage | 1.435 | 0.231 | |||
| T1-T2 | 131 (18.8) | 86 (17.7) | 45 (21.5) | ||
| T3-T4 | 565 (81.2) | 401 (82.3) | 164 (78.5) | ||
| N stage | 0.309 | 0.578 | |||
| N0-N1 | 404 (58.0) | 286 (58.7) | 118 (56.5) | ||
| N2 | 292 (42.0) | 201 (41.3) | 91 (43.5) | ||
| Hypertension | 0.094 | 0.759 | |||
| Yes | 224 (32.2) | 155 (31.8) | 69 (33.0) | ||
| No | 472 (67.8) | 332 (68.2) | 140 (67.0) | ||
| Diabetes | 0.001 | 0.977 | |||
| Yes | 127 (18.2) | 89 (18.3) | 38 (18.2) | ||
| No | 569 (81.8) | 398 (81.7) | 171 (81.8) | ||
| Smoke | 0.599 | 0.439 | |||
| Yes | 291 (41.8) | 199 (40.9) | 92 (44.0) | ||
| No | 405 (58.2) | 288 (59.1) | 117 (56.0) | ||
| Alcohol | 0.056 | 0.813 | |||
| Yes | 295 (42.4) | 205 (42.1) | 90 (43.1) | ||
| No | 401 (57.6) | 282 (57.9) | 119 (56.9) | ||
| Surgical approach | 0.009 | 0.925 | |||
| Laparoscopic | 672 (96.6) | 470 (96.5) | 202 (96.7) | ||
| Open | 24 (3.4) | 17 (3.5) | 7 (3.3) | ||
| Surgical procedure | 0.288 | 0.592 | |||
| LAR | 578 (83.0) | 402 (82.5) | 176 (84.2) | ||
| APR | 118 (17.0) | 85 (17.5) | 33 (15.8) | ||
| Neoadjuvant treatment | 0.043 | 0.836 | |||
| Yes | 86 (12.3) | 61 (12.5) | 25 (12.0) | ||
| No | 610 (87.7) | 426 (87.5) | 184 (88.0) | ||
| SMI | 1.069 | 0.301 | |||
| High | 297 (42.7) | 214 (43.9) | 83 (39.7) | ||
| Low | 399 (57.3) | 273 (56.1) | 126 (60.3) | ||
| SATI | 0.054 | 0.816 | |||
| High | 415 (59.6) | 289 (59.3) | 126 (60.3) | ||
| Low | 281 (40.4) | 198 (40.7) | 83 (39.7) |
Tab. 2
Comparison of clinical characteristics between the low body composition group and the high body composition group [n (%)]"
| Variable | SMI | χ2 value | P value | SATI | χ2 value | P value | ||
|---|---|---|---|---|---|---|---|---|
| Low (N=399) | High (N=297) | Low (N=281) | High (N=415) | |||||
| Gender | 12.654 | <0.001 | 12.757 | <0.001 | ||||
| Male | 225 (56.4) | 127 (42.8) | 119 (42.3) | 233 (56.1) | ||||
| Female | 174 (43.6) | 170 (57.2) | 162 (57.7) | 182 (43.9) | ||||
| Age/year | 18.129 | <0.001 | 0.145 | 0.703 | ||||
| <65 | 166 (41.6) | 172 (57.9) | 134 (47.7) | 204 (49.2) | ||||
| ≥65 | 233 (58.4) | 125 (42.1) | 147 (52.3) | 211 (50.8) | ||||
| BMI/(kg·m-²) | 9.166 | 0.002 | 52.526 | <0.001 | ||||
| <22.45 | 112 (28.1) | 54 (18.2) | 107 (38.1) | 59 (14.2) | ||||
| ≥22.45 | 287 (71.9) | 243 (81.8) | 174 (61.9) | 356 (85.8) | ||||
| CEA/(ng·mL-1) | 7.380 | 0.007 | 0.015 | 0.903 | ||||
| <4.26 | 195 (48.9) | 176 (59.3) | 149 (53.0) | 222 (53.5) | ||||
| ≥4.26 | 204 (51.1) | 121 (40.7) | 132 (47.0) | 193 (46.5) | ||||
| Size/cm | 12.208 | <0.001 | 5.565 | 0.018 | ||||
| <5.2 | 277 (69.4) | 168 (56.6) | 165 (58.7) | 280 (67.5) | ||||
| ≥5.2 | 122 (30.6) | 129 (43.4) | 116 (41.3) | 135 (32.5) | ||||
| T stage | 12.318 | <0.001 | 0.934 | 0.334 | ||||
| T1-T2 | 93 (23.3) | 38 (12.8) | 48 (17.1) | 83 (20.0) | ||||
| T3-T4 | 306 (76.7) | 259 (87.2) | 233 (82.9) | 332 (80.0) | ||||
| N stage | 0.313 | 0.576 | 0.586 | 0.444 | ||||
| N0-N1 | 228 (57.1) | 176 (59.3) | 168 (59.8) | 236 (56.9) | ||||
| N2 | 171 (42.9) | 121 (40.7) | 113 (40.2) | 179 (43.1) | ||||
| Hypertension | 0.180 | 0.671 | 2.979 | 0.084 | ||||
| Yes | 131 (32.8) | 93 (31.3) | 80 (28.5) | 144 (34.7) | ||||
| No | 268 (67.2) | 204 (68.7) | 201 (71.5) | 271 (65.3) | ||||
| Diabetes | 2.038 | 0.153 | 0.065 | 0.799 | ||||
| Yes | 80 (20.1) | 47 (15.8) | 50 (17.8) | 77 (18.6) | ||||
| No | 319 (79.9) | 250 (84.2) | 231 (82.2) | 338 (81.4) | ||||
| Smoke | 0.001 | 0.978 | 0.494 | 0.482 | ||||
| Yes | 167 (41.9) | 124 (41.8) | 113 (40.2) | 178 (42.9) | ||||
| No | 232 (58.1) | 173 (58.2) | 168 (59.8) | 237 (57.1) | ||||
| Alcohol | 0.234 | 0.629 | 0.001 | 0.987 | ||||
| Yes | 166 (41.6) | 129 (43.4) | 119 (42.3) | 176 (42.4) | ||||
| No | 233 (58.4) | 168 (56.6) | 162 (57.7) | 239 (57.6) | ||||
| Surgical approach | 1.342 | 0.247 | 0.308 | 0.579 | ||||
| Laparoscopic | 388 (97.2) | 284 (95.6) | 270 (96.1) | 402 (96.9) | ||||
| Open | 11 (2.8) | 13 (4.4) | 11 (3.9) | 13 (3.1) | ||||
| Surgical procedure | 3.119 | 0.077 | 0.562 | 0.453 | ||||
| LAR | 340 (85.2) | 238 (80.1) | 237 (84.3) | 341 (82.2) | ||||
| APR | 59 (14.8) | 59 (19.9) | 44 (15.7) | 74 (17.8) | ||||
| Neoadjuvant treatment | 0.092 | 0.762 | 0.763 | 0.382 | ||||
| Yes | 48 (12.0) | 38 (12.8) | 31 (11.0) | 55 (13.3) | ||||
| No | 351 (88.0) | 259 (87.2) | 250 (89.0) | 360 (86.7) | ||||
Tab. 3
Univariate and multivariate analysis of factors associated with RFS in the training cohort"
| Variable | Univariate | Multivariate | |||||
|---|---|---|---|---|---|---|---|
| HR | 95%Cl | P value | HR | 95% Cl | P value | ||
| SATI (high vs low) | 3.027 | 1.676-5.467 | <0.001 | 2.717 | 1.505-4.905 | <0.001 | |
| SMI (high vs low) | 0.296 | 0.164-0.533 | <0.001 | 0.329 | 0.182-0.595 | <0.001 | |
| Sex (female vs male) | 1.048 | 0.649-1.692 | 0.849 | ||||
| Age (≥65 years vs <65 years) | 1.538 | 0.941-2.514 | 0.086 | ||||
| Hypertension (yes vs no) | 0.939 | 0.560-1.574 | 0.811 | ||||
| Diabetes (yes vs no) | 1.054 | 0.575-1.932 | 0.865 | ||||
| Smoke (yes vs no) | 0.840 | 0.512-1.379 | 0.491 | ||||
| Alcohol (yes vs no) | 0.952 | 0.586-1.548 | 0.844 | ||||
| Surgical approach (open vs laparoscopic) | 0.328 | 0.045-2.369 | 0.269 | ||||
| Surgical procedure (APR vs LAR) | 0.610 | 0.292-1.277 | 0.190 | ||||
| Neoadjuvant treatment (yes vs no) | 0.739 | 0.338-1.619 | 0.450 | ||||
| BMI (≥21.83 kg/m2 vs <21.83 kg/m2) | 1.812 | 0.926-3.549 | 0.083 | ||||
| CEA (≥4.39 ng/mL vs <4.39 ng/mL) | 1.587 | 0.979-2.574 | 0.061 | ||||
| Size (≥5.5 cm vs <5.5 cm) | 0.663 | 0.390-1.129 | 0.130 | ||||
| T stage (T3+T4 vs T1+T2) | 7.555 | 1.850-30.856 | 0.005 | 7.205 | 1.762-29.473 | 0.006 | |
| N stage (N2 vs N0+N1) | 6.230 | 3.456-11.233 | <0.001 | 5.443 | 3.014-9.829 | <0.001 | |
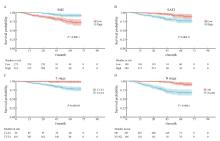
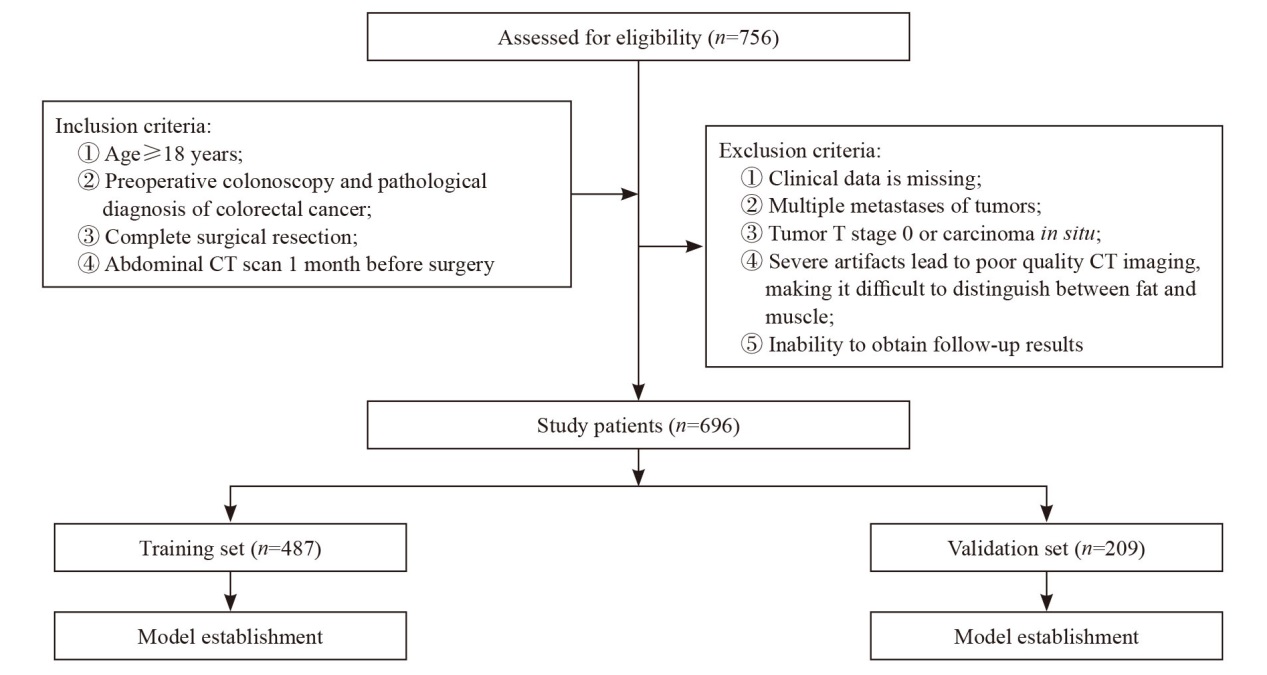
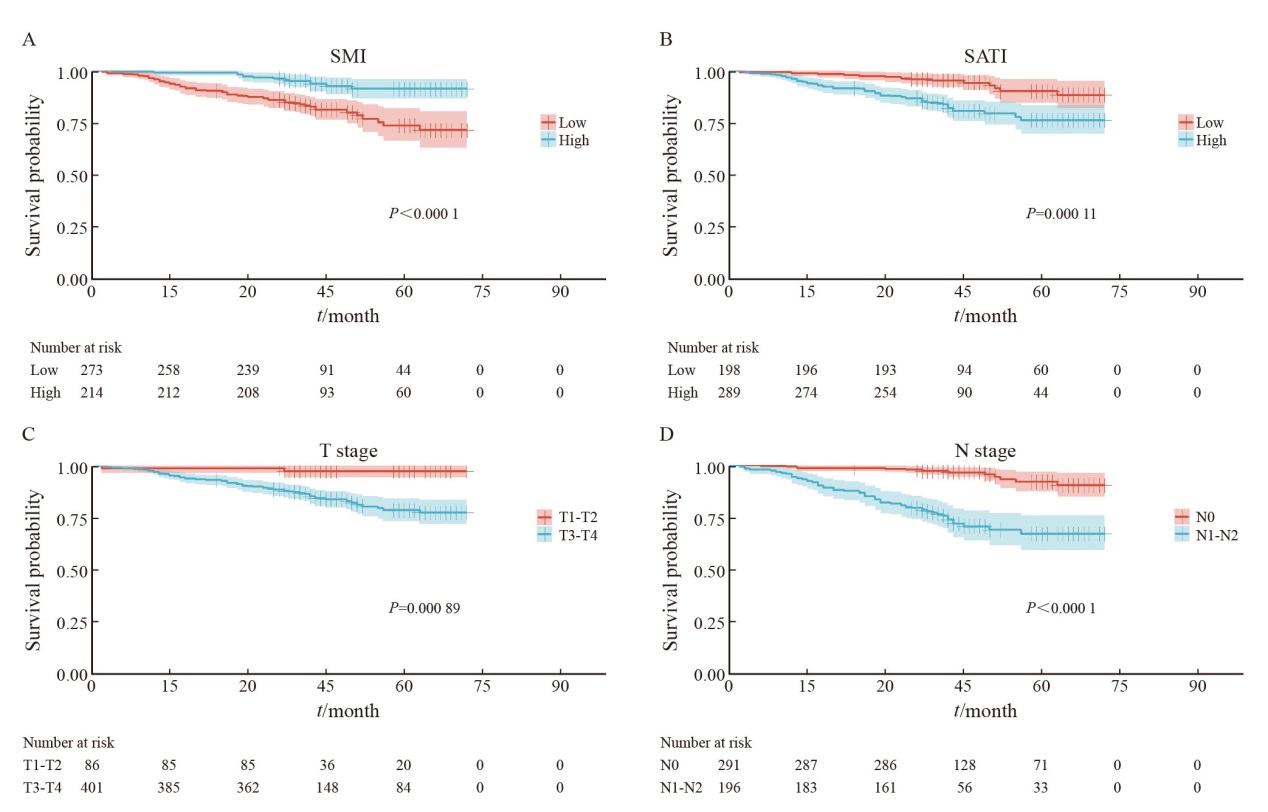
Fig. 2
Comparison of RFS in different groups of patients A: Patients with high or low SMI; B: Patients with high or low SATI; C: Patients with T3 and T4 or T1 and T2; D: Patients with N1 and N2 or N0."
Tab. 4
Univariate and multivariate analysis of factors associated with OS in the training cohort"
| Variable | Univariate | Multivariate | |||||
|---|---|---|---|---|---|---|---|
| HR | 95% Cl | P value | HR | 95% Cl | P value | ||
| SATI (high vs low) | 4.820 | 2.367-9.815 | <0.001 | 3.542 | 1.739-7.211 | <0.001 | |
| SMI (high vs low) | 0.097 | 0.039-0.243 | <0.001 | 0.132 | 0.053-0.330 | <0.001 | |
| Sex (female vs male) | 0.793 | 0.476-1.319 | 0.371 | ||||
| Age (≥65 years vs <65 years) | 1.744 | 1.025-2.965 | 0.040 | 0.216 | |||
| Hypertension (yes vs no) | 0.906 | 0.526-1.563 | 0.723 | ||||
| Diabetes (yes vs no) | 0.675 | 0.321-1.422 | 0.301 | ||||
| Smoke (yes vs no) | 0.921 | 0.549-1.545 | 0.755 | ||||
| Alcohol (yes vs no) | 0.881 | 0.525-1.477 | 0.631 | ||||
| Surgical approach (open vs laparoscopic) | 0.045 | 0.001-7.094 | 0.230 | ||||
| Surgical procedure (APR vs LAR) | 1.025 | 0.533-1.971 | 0.941 | ||||
| Neoadjuvant treatment (yes vs no) | 0.414 | 0.150-1.146 | 0.090 | ||||
| BMI (≥21.83 kg/m2 vs <21.83 kg/m2) | 1.531 | 0.776-3.019 | 0.219 | ||||
| CEA (≥4.39 ng/mL vs <4.39 ng/mL) | 1.457 | 0.876-2.423 | 0.147 | ||||
| Size (≥5.5 cm vs <5.5 cm) | 0.573 | 0.323-1.018 | 0.057 | ||||
| T stage (T3+T4 vs T1+T2) | 13.201 | 1.829-95.291 | 0.011 | 11.478 | 1.588-82.952 | 0.016 | |
| N stage (N2 vs N0+N1) | 10.374 | 4.926-21.849 | <0.001 | 7.779 | 3.683-16.430 | <0.001 | |
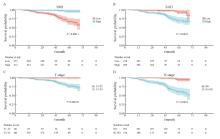
Fig. 3
Comparison of OS in different groups of patients A: Patients with high or low SMI; B: Patients with high or low SATI; C: Patients with T3 and T4 or T1 and T2; D: Patients with N1 and N2 or N0."
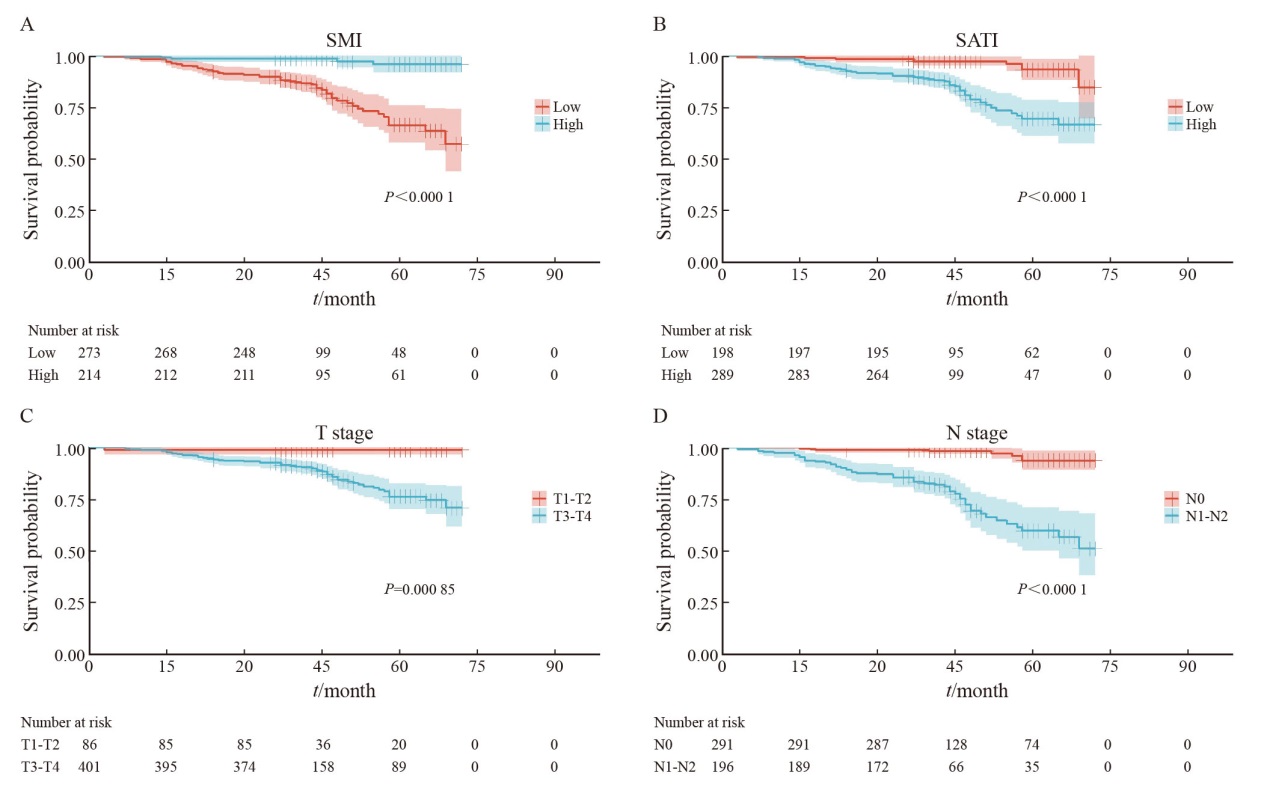
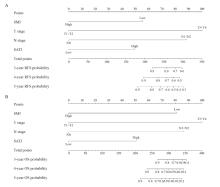
Fig. 4
The nomogram models based on independent risk factors A: Model A (predict the risk of 3-, 4-, and 5-year adverse RFS in patients with rectal cancer); B: Model B (predict the risk of 3-, 4-, and 5-year adverse OS in patients with rectal cancer)."
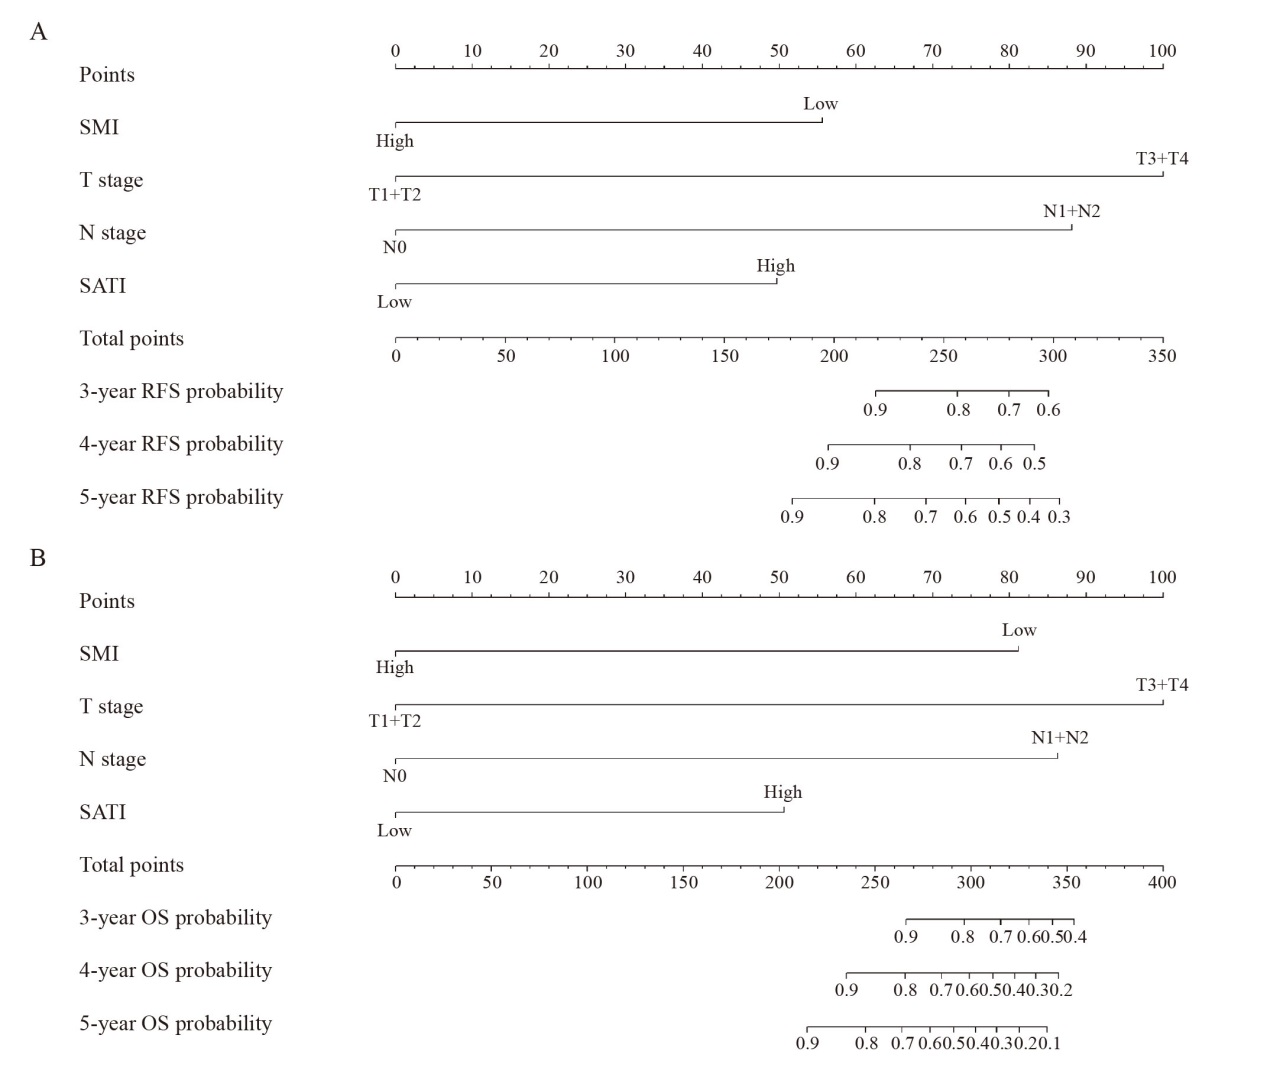
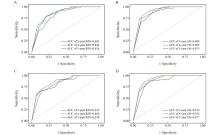
Fig. 5
ROC curves of OS and RFS prediction models for the training set and validation set A: ROC curve of model for predicting 3,4,5-year RFS in the training set; B: The ROC curve of model for predicting 3-, 4-, and 5-year OS in the training set; C: The ROC curve of model for predicting 3,4, and 5-year RFS in the validation set; D: The ROC curve of model for predicting 3-, 4-, and 5-year OS in the validation set."
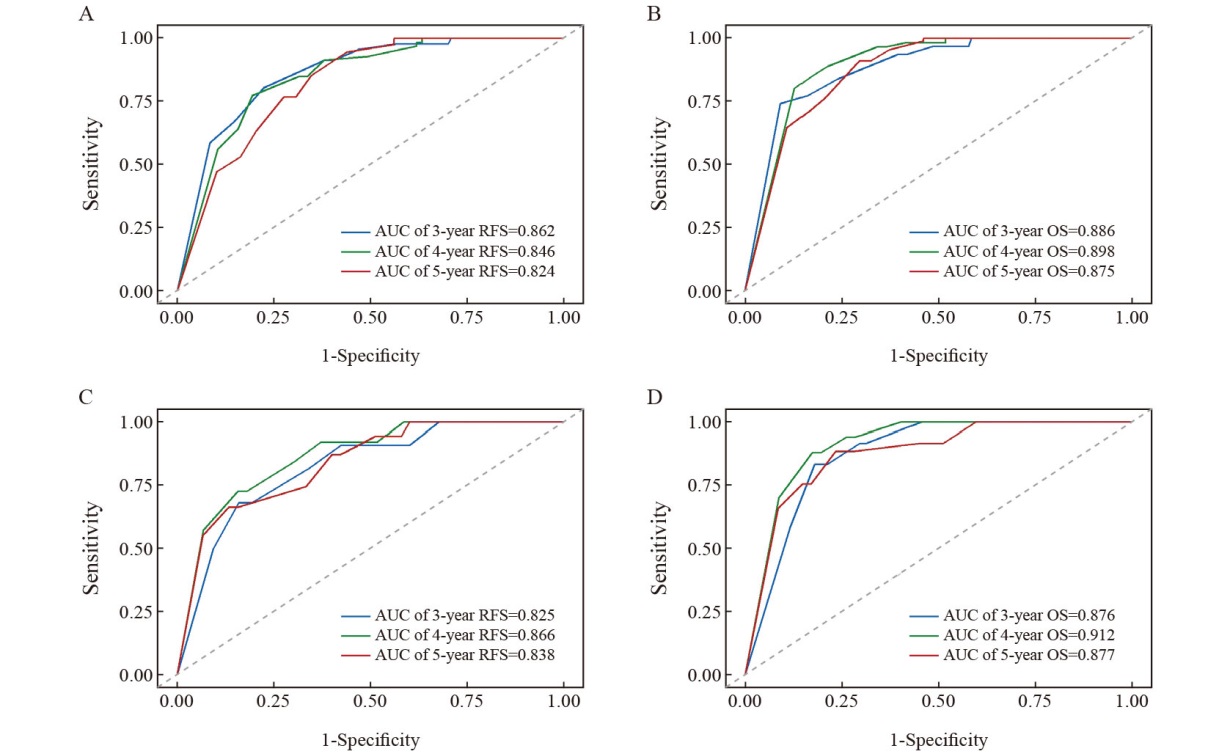
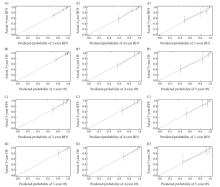
Fig. 6
Calibration diagram of OS and RFS prediction models for the training set and validation set The calibration plots of the 3-year (A1), 4-year (A2) and 5-year (A3) RFS of the prediction model in the training set. The calibration plots of the 3-year (B1), 4-year (B2) and 5-year (B3) OS of the prediction model in the training set. The calibration plots of 3-year (C1), 4-year (C2) and 5-year (C3) RFS in the validation set. The calibration plots of the 3-year (D1), 4-year (D2) and 5-year (D3) OS in the validation set."
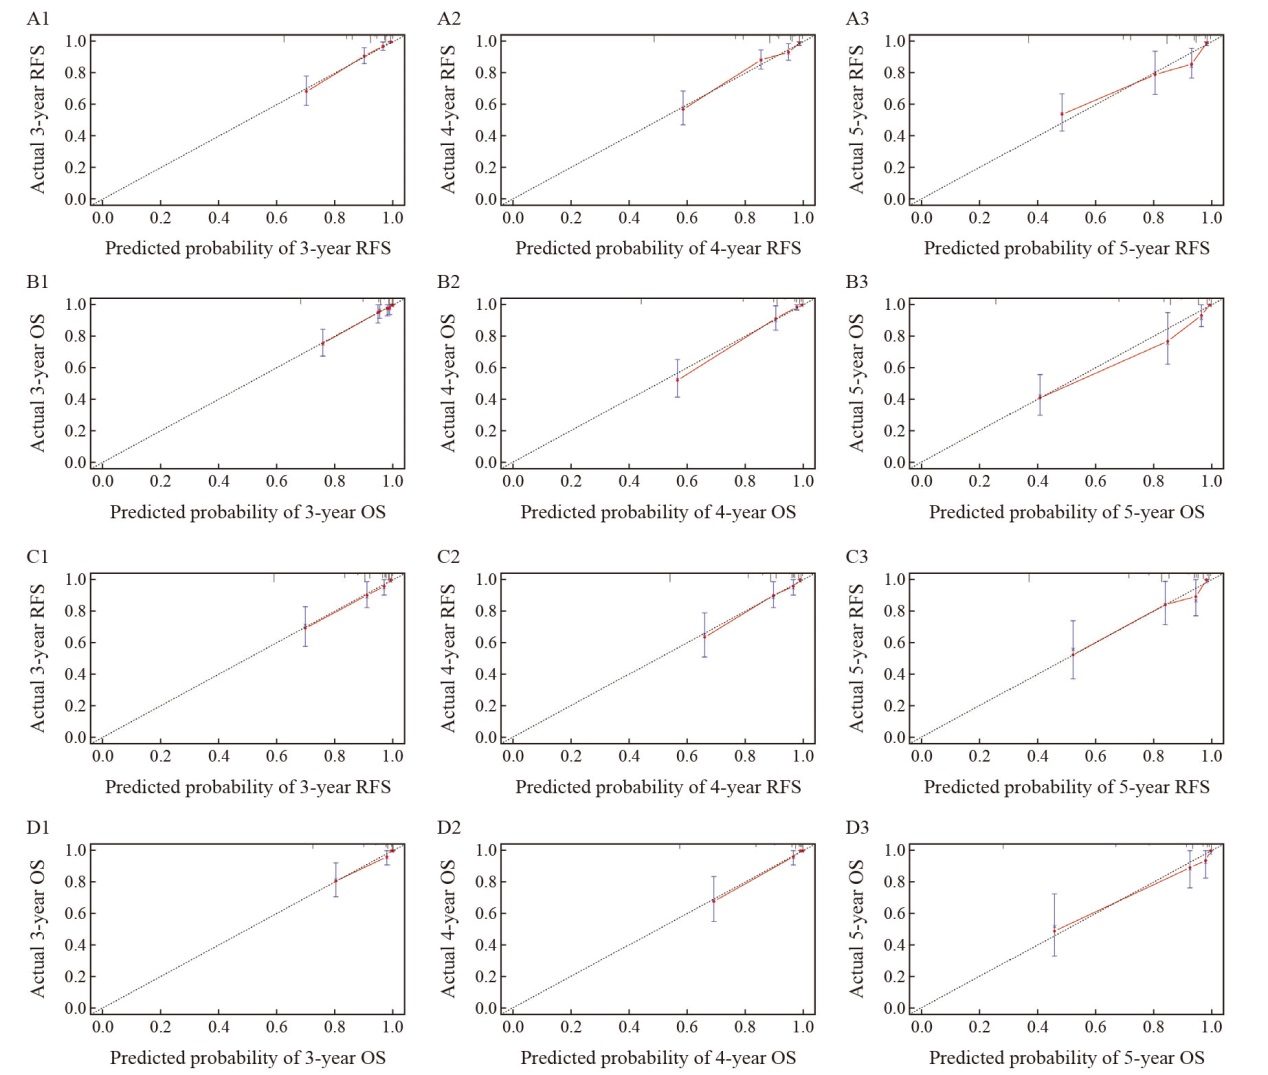
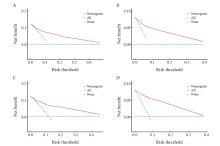
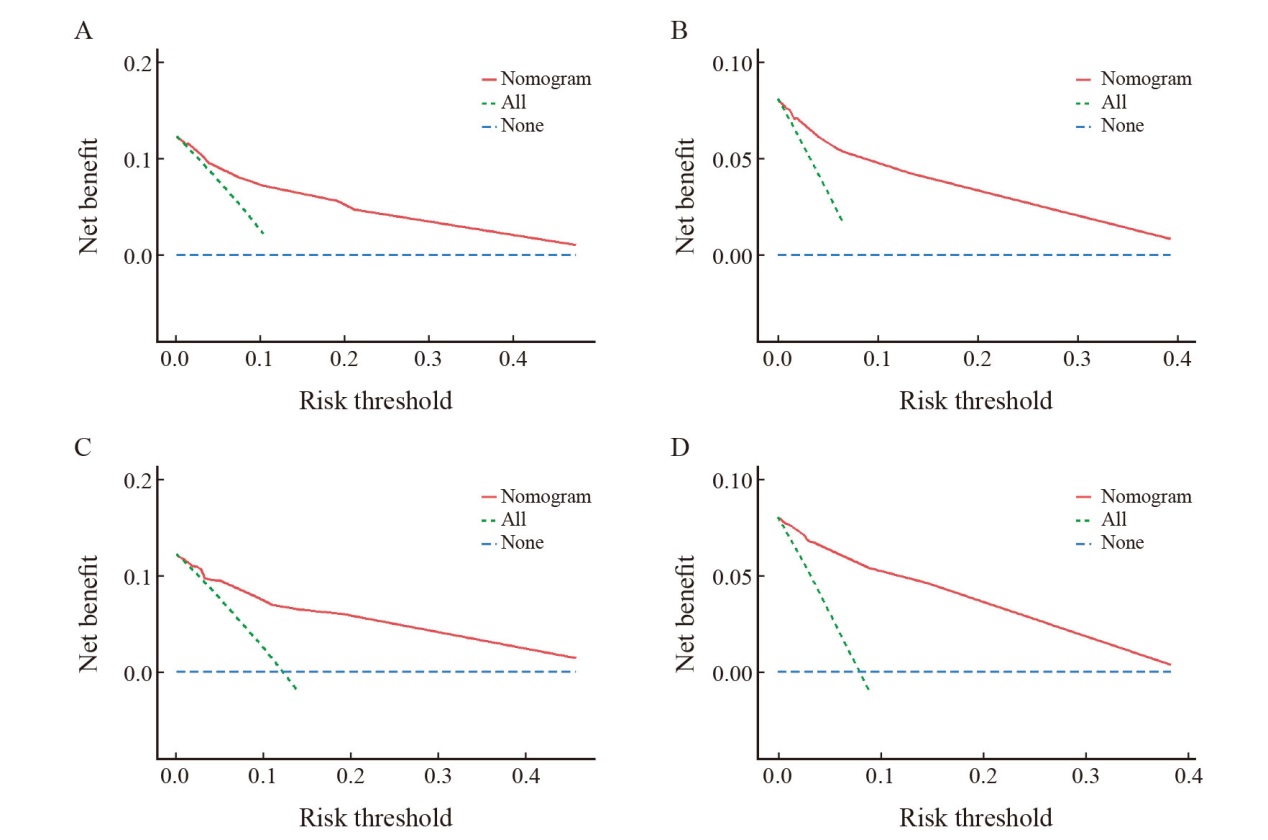
Fig. 7
DCA curves of OS and RFS prediction models for the training set and validation set A: Decision curve analysis of the model for predicting RFS in the training set; B: Decision curve analysis of the OS prediction model in the training set; C: Validation of the decision curve analysis of the RFS model; D: Validation of the decision curve analysis of the OS model."
| [1] | 郑荣寿, 陈茹, 韩冰峰, 等. 2022年中国恶性肿瘤流行情况分析[J]. 中华肿瘤杂志, 2024, 46(3): 221-231. |
| ZHENG R S, CHEN R, HAN B F, et al. Cancer incidence and mortality in China, 2022[J]. Chin J Oncol, 2024, 46(3): 221-231. | |
| [2] | MILLER K D, NOGUEIRA L, DEVASIA T, et al. Cancer treatment and survivorship statistics, 2022[J]. CA Cancer J Clin, 2022, 72(5): 409-436. |
| [3] | GAO J, LIU Y. Prediction and the influencing factor study of colorectal cancer hospitalization costs in China based on machine learning-random forest and support vector regression: a retrospective study[J]. Front Public Health, 2024, 12: 1211220. |
| [4] | CARBAJAL-LÓPEZ B, CORONEL-HERNÁNDEZ J, HERRERA M, et al. Age as a predictor of overall survival in colorectal cancer[J]. Diagnostics (Basel), 2024, 14(22): 2550. |
| [5] | CAI L Q, YANG D Q, WANG R J, et al. Establishing and clinically validating a machine learning model for predicting unplanned reoperation risk in colorectal cancer[J]. World J Gastroenterol, 2024, 30(23): 2991-3004. |
| [6] |
XU C, ZHANG L, LIU H Q, et al. Faeces from malnourished colorectal cancer patients accelerate cancer progression[J]. Clin Nutr, 2022, 41(3): 632-644.
doi: 10.1016/j.clnu.2022.01.001 pmid: 35124471 |
| [7] | WU W Z, LIU R Q, WANG D S, et al. Application of computed tomography body composition in patients with locally progressive gastric cancer undergoing radical surgery combined with prophylactic hyperthermic intraperitoneal chemotherapy[J]. Nutrition, 2025, 132: 112686. |
| [8] | BENNETT J P, LIM S. The critical role of body composition assessment in advancing research and clinical health risk assessment across the lifespan[J]. J Obes Metab Syndr, 2025, 34(2): 120-137. |
| [9] | NIE T, WU F H, HENG Y X, et al. Influence of skeletal muscle and intermuscular fat on postoperative complications and long-term survival in rectal cancer patients[J]. J Cachexia Sarcopenia Muscle, 2024, 15(2): 702-717. |
| [10] | YUAN L Y, WANG L Y, GAO J M, et al. OncoE25: an AI model for predicting postoperative prognosis in early-onset stage Ⅰ-Ⅲ colon and rectal cancer-a population-based study using SEER with dual-center cohort validation[J]. J Transl Med, 2025, 23(1): 695. |
| [11] | Diagnosis And Treatment Guidelines For Colorectal Cancer Working Group CSOCOC. Chinese Society of Clinical Oncology (CSCO) diagnosis and treatment guidelines for colorectal cancer 2018 (english version)[J]. Chin J Cancer Res, 2019, 31(1): 117-134. |
| [12] | RAI J, PRING E T, KNIGHT K, et al. Sarcopenia is independently associated with poor preoperative physical fitness in patients undergoing colorectal cancer surgery[J]. J Cachexia Sarcopenia Muscle, 2024, 15(5): 1850-1857. |
| [13] | DE LUIS ROMAN D, LÓPEZ GÓMEZ J J, MUÑOZ M, et al. Evaluation of muscle mass and malnutrition in patients with colorectal cancer using the global leadership initiative on malnutrition criteria and comparing bioelectrical impedance analysis and computed tomography measurements[J]. Nutrients, 2024, 16(17): 3035. |
| [14] |
PRADO C M, LIEFFERS JR, MCCARGAR L J, et al. Prevalence and clinical implications of sarcopenic obesity in patients with solid tumours of the respiratory and gastrointestinal tracts: a population-based study[J]. Lancet Oncol, 2008, 9(7): 629-635.
doi: 10.1016/S1470-2045(08)70153-0 pmid: 18539529 |
| [15] | DA SILVA DIAS D, MACHADO M, TRABULO C, et al. Impact of body composition on prognosis and dose-limiting toxicities on metastatic colorectal cancer[J]. Front Nutr, 2021, 8: 671547. |
| [16] | YANG N J, ZHOU P, LYU J H, et al. Prognostic value of sarcopenia and myosteatosis alterations on survival outcomes for esophageal squamous cell carcinoma before and after radiotherapy[J]. Nutrition, 2024, 127: 112536. |
| [17] | VAN HEUSDEN H C, VAN BEERS M A, SCHAEFFERS A W M A, et al. The predictive and prognostic role of radiologically defined sarcopenia in head and neck cancer: a systematic review and multi-level meta-analysis[J]. Br J Cancer, 2025. |
| [18] | KIM I H, CHOI M H, LEE I S, et al. Clinical significance of skeletal muscle density and sarcopenia in patients with pancreatic cancer undergoing first-line chemotherapy: a retrospective observational study[J]. BMC Cancer, 2021, 21(1): 77. |
| [19] | ABE S, NOZAWA H, SASAKI K, et al. Sarcopenia is associated with oncological prognosis and the incidence of secondary cancer in patients with middle/lower rectal cancer[J]. Clin Colorectal Cancer, 2023, 22(1): 143-152. |
| [20] | LIN W L, NGUYEN T H Y, HUANG W T, et al. Sarcopenia and survival in colorectal cancer without distant metastasis: a systematic review and meta-analysis[J]. J Gastroenterol Hepatol, 2024, 39(11): 2250-2259. |
| [21] | TAKIGUCHI K, FURUYA S, SUDO M, et al. Prognostic effect of sarcopenia in colorectal cancer recurrence[J]. Nutrition, 2021, 91/92: 111362. |
| [22] | SIFF T, PARAJULI P, RAZZAQUE M S, et al. Cancer-mediated muscle cachexia: etiology and clinical management[J]. Trends Endocrinol Metab, 2021, 32(6): 382-402. |
| [23] | RUAN G T, GE Y Z, XIE H L, et al. Association between systemic inflammation and malnutrition with survival in patients with cancer sarcopenia-a prospective multicenter study[J]. Front Nutr, 2021, 8: 811288. |
| [24] |
ZHANG Y J, ZHANG J J, ZHAN Y F, et al. Sarcopenia is a prognostic factor of adverse effects and mortality in patients with tumour: a systematic review and meta-analysis[J]. J Cachexia Sarcopenia Muscle, 2024, 15(6): 2295-2310.
doi: 10.1002/jcsm.13629 pmid: 39529263 |
| [25] | BOSSI P, DELRIO P, MASCHERONI A, et al. The spectrum of malnutrition/cachexia/sarcopenia in oncology according to different cancer types and settings: a narrative review[J]. Nutrients, 2021, 13(6): 1980. |
| [26] | HE J, LUO W, HUANG Y Y, et al. Sarcopenia as a prognostic indicator in colorectal cancer: an updated meta-analysis[J]. Front Oncol, 2023, 13: 1247341. |
| [27] | XIE H L, WEI L S, GAO S H, et al. Prognostic significance of sarcopenia diagnosed based on the anthropometric equation for progression-free survival and overall survival in patients with colorectal cancer[J]. Front Nutr, 2023, 10: 1076589. |
| [28] |
LI X, LIAN Y J, PING W W, et al. Abdominal obesity and digestive system cancer: a systematic review and meta-analysis of prospective studies[J]. BMC Public Health, 2023, 23(1): 2343.
doi: 10.1186/s12889-023-17275-2 pmid: 38012596 |
| [29] | FU R J, CHEN X C, NIEDERMAIER T, et al. Excess weight, polygenic risk score, and findings of colorectal neoplasms at screening colonoscopy[J]. Am J Gastroenterol, 2024, 119(9): 1913-1920. |
| [30] | LI Y, WU X Q, SONG Y F, et al. The short- and long-term readmission of four major categories of digestive system cancers: Does obesity or metabolic disorder matter?[J]. Front Endocrinol (Lausanne), 2023, 14: 1214651. |
| [31] | CHANG M L, YANG Z, YANG S S. Roles of adipokines in digestive diseases: markers of inflammation, metabolic alteration and disease progression[J]. Int J Mol Sci, 2020, 21(21): 8308. |
| [32] | PACQUELET B, MORELLO R, PELAGE J P, et al. Abdominal adipose tissue quantification and distribution with CT: prognostic value for surgical and oncological outcome in patients with rectal cancer[J]. Eur Radiol, 2022, 32(9): 6258-6269. |
| Viewed | ||||||
|
Full text |
|
|||||
|
Abstract |
|
|||||
沪ICP备12009617
Powered by Beijing Magtech Co. Ltd