Welcome to China Oncology,
|
||||||||||||||||||||||||||||||||||||||||||||||||||||||||||||||||||||||||||||
|
Application value of decision tree model based on ultrasonic signs in predicting the risk grade of gastrointestinal stromal tumors
China Oncology
2022, 32 (1):
41-46.
DOI: 10.19401/j.cnki.1007-3639.2022.01.005
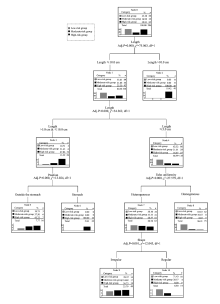
Background and purpose: The biological risk of gastrointestinal stromal tumor (GIST) can be divided into very low-risk, low-risk, moderate-risk and high-risk. Accurate preoperative prediction of risk is very important for clinical diagnosis and treatment. This study explored the application value of decision tree model based on ultrasonic signs in predicting the risk grade of GIST. Methods: A total of 206 GIST patients treated in Union Hospital Affiliated to Fujian Medical University from December 2016 to December 2020 were collected. The decision tree model was established, and the prediction accuracy of the model was calculated. Results: There were statistically significant differences in long diameter, short diameter/long diameter (S/L), location, internal echo, echo uniformity, boundary, shape, cystic necrosis and blood flow signals among low-risk, moderate-risk and high-risk groups (all P<0.05). The prediction accuracy of the decision tree model based on the long diameter, location, echo uniformity and shape was 72.33%, and the prediction accuracies of the low-risk group and high-risk group were 80.90% and 93.90%, respectively. Conclusion: The decision tree model based on ultrasonic signs has high application value in predicting the risk grade of GIST.
Tab. 2
The comparison of indicators in different risk groups
Other Images/Table from this Article
|
||||||||||||||||||||||||||||||||||||||||||||||||||||||||||||||||||||||||||||